Seems librosa is a really popular python library for audio processing. By using librosa, I can show the MFCC of the sound from a bird by just some simple lines of python:
import librosa
import matplotlib.pyplot as plt
from matplotlib import cm
audio, sample_rate = librosa.load("shriek.mp3")
mfccs = librosa.feature.mfcc(y=audio, sr=sample_rate, n_mfcc=40)
fig, ax = plt.subplots()
ax.imshow(mfccs, interpolation="nearest", cmap=cm.coolwarm, origin="lower", aspect="auto")
ax.set_title("MFCC")
plt.show()
The image looks like below:
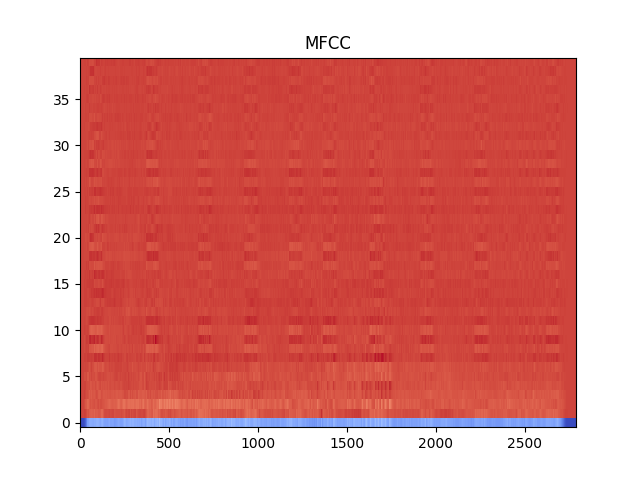
I know that It’s not intuitive for guys like me to understand the meaning of this type of spectrum-images. But it should be suitable for some machine learning model to recognize, such as CNN.